Spray Characterization

from droplet size to spray distribution

Tiny Details. Big Impact.

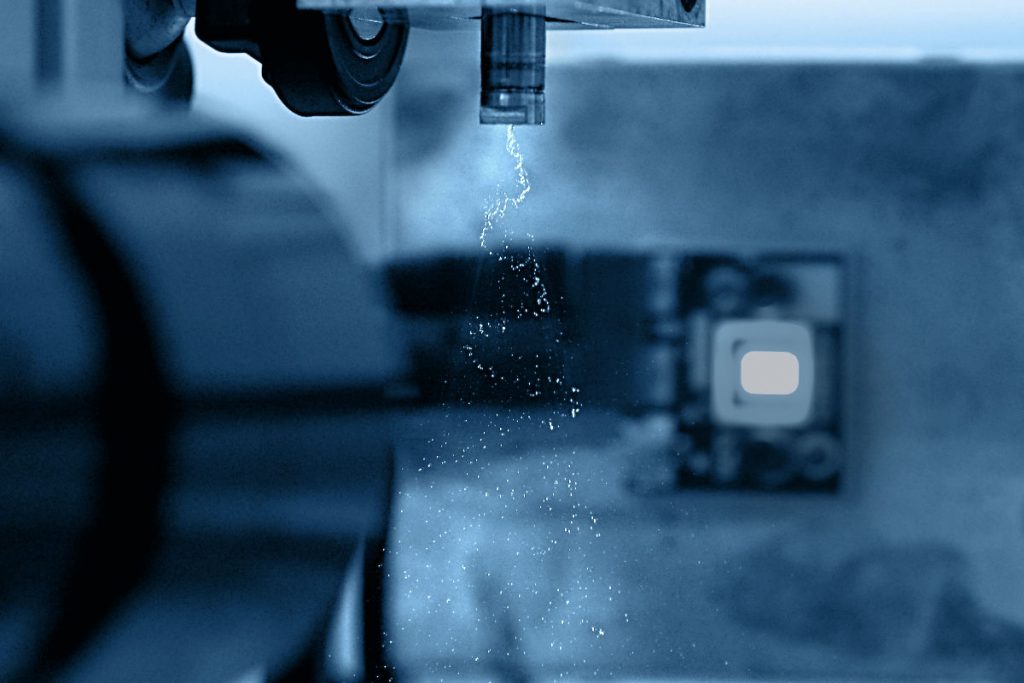
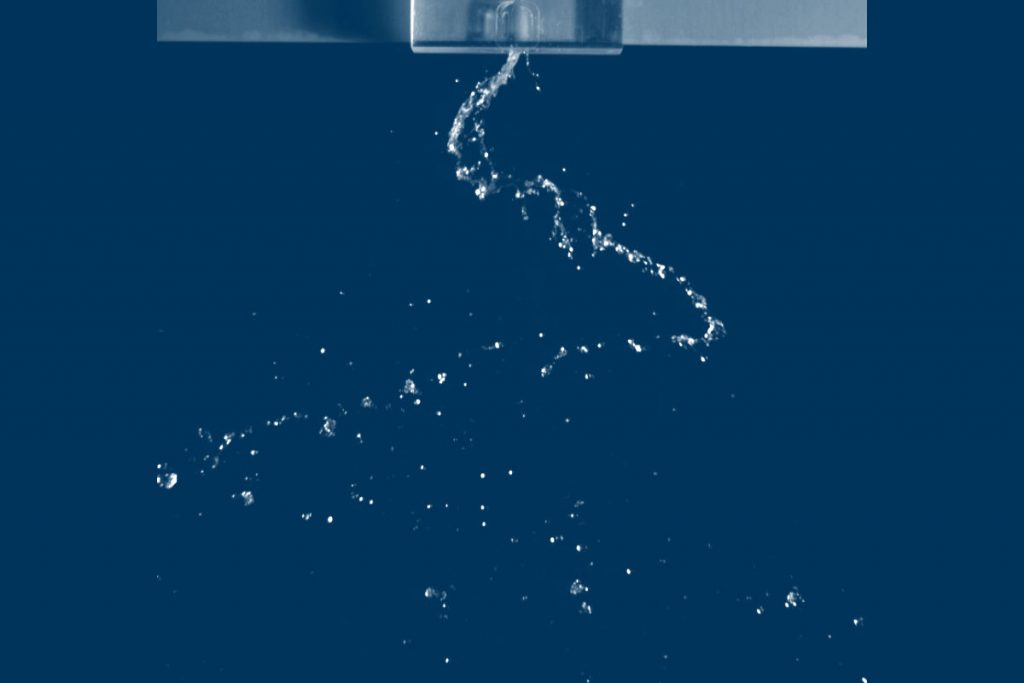
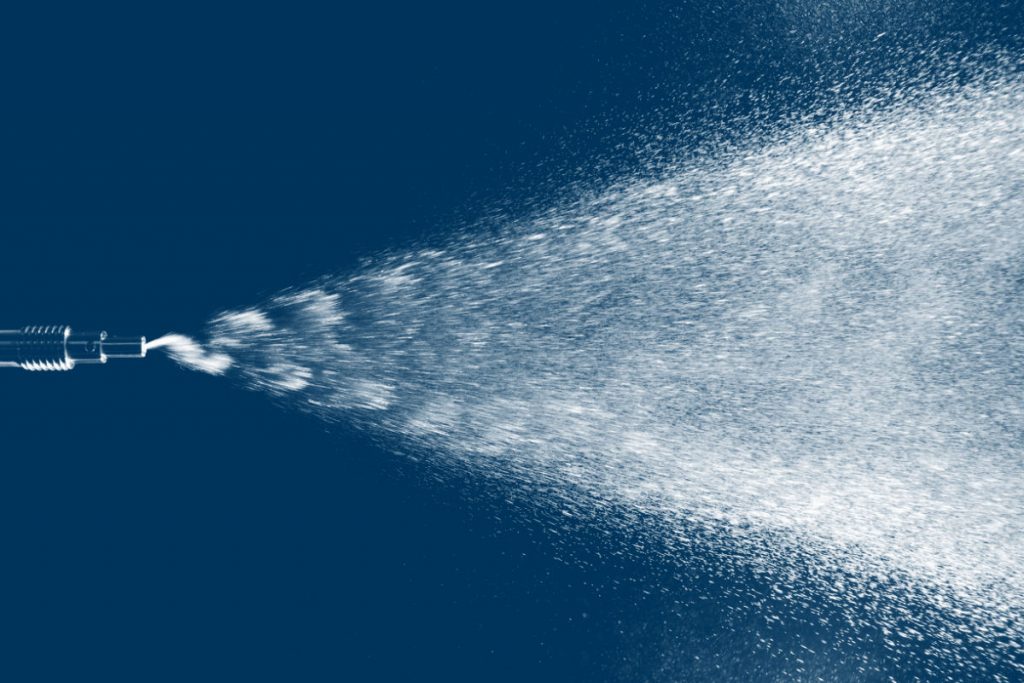
From high-pressure cleaners to asthma sprays, the distribution and application of liquids is an essential purpose of nozzles. In order to be able to use the right nozzle in a targeted manner, it is therefore essential to know its spray properties. The properties not only determine the efficiency of a process, but also its effectiveness. Droplets that are too small, for example, are simply carried away by convection during spray cooling, or merely wet the surface during a cleaning application without imposing mechanical forces. In contrast, droplets that are too large do not reach their point of application in an asthma spray.

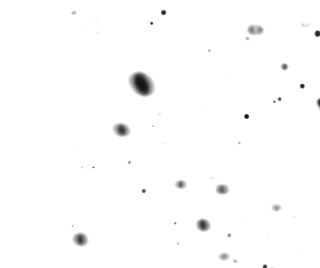
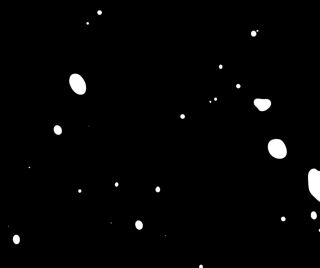
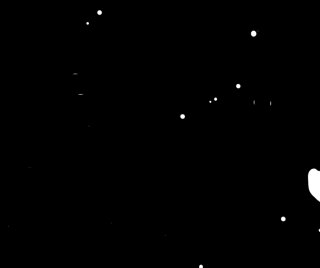
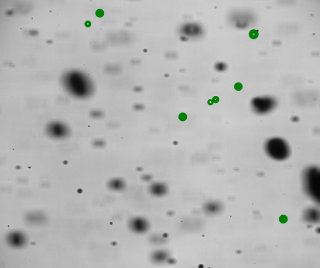
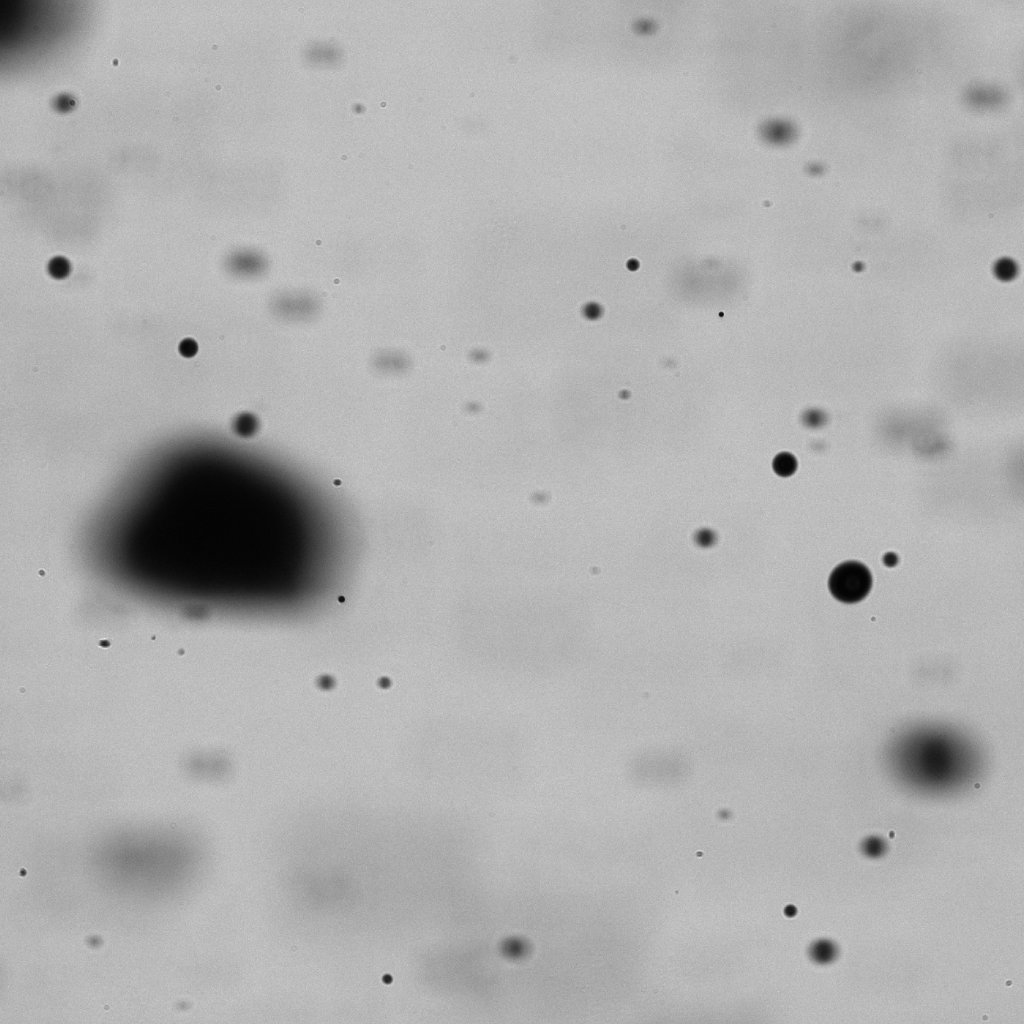
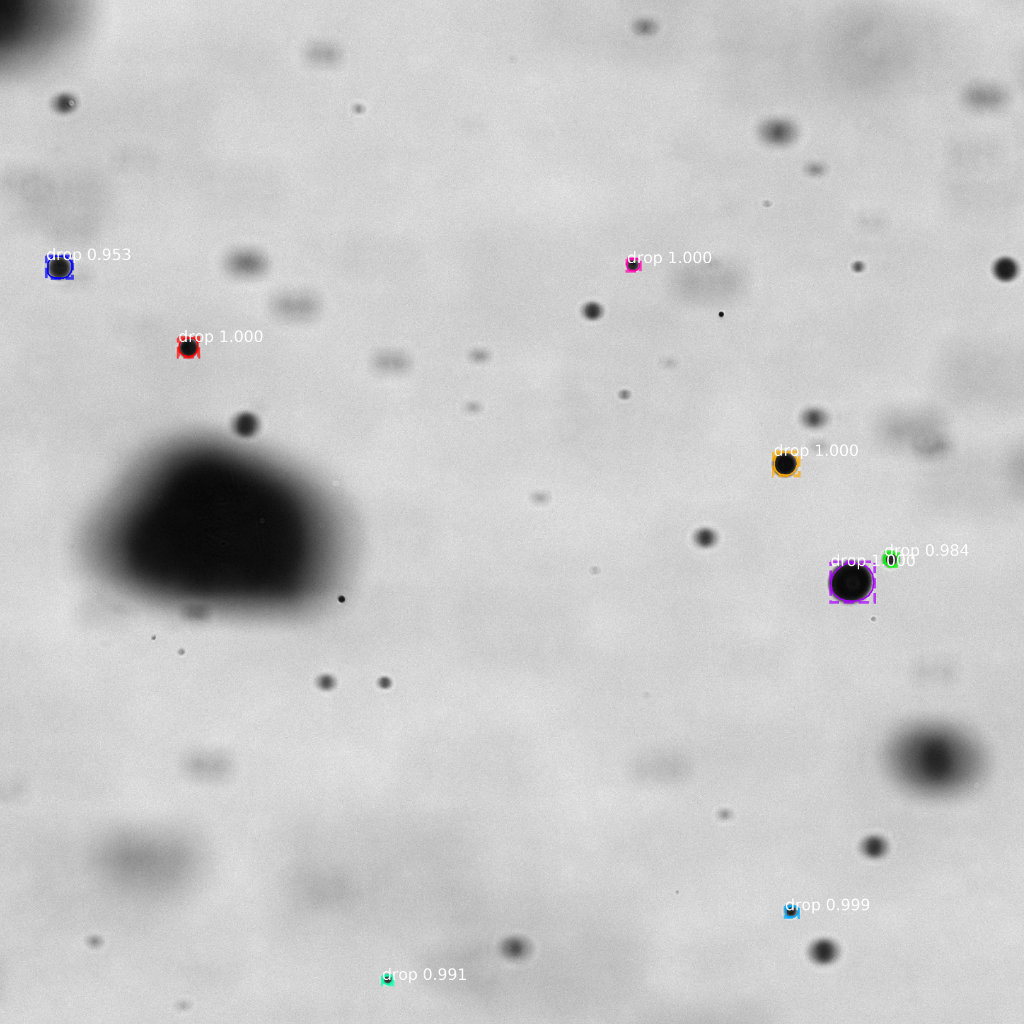
To make matters worse, the technically relevant nozzles do not deliver a constant droplet size over all droplets, but a size distribution that can also vary spatially and even temporally. The detection and especially the evaluation of these properties is often of great importance.

Our Service. Your Support.

To characterize our nozzles, we have built a test rig with which we can determine the essential parameters of a spray. This includes the droplet size distribution, the integral spatial spray distribution, the spray width/throw distance and of course the pressure-flow behavior. Our setup is mobile, allowing on-site measurements as long as optical access is available. In cooperation with our partners, we can also measure many other configurations, including laser-based systems (PDA, PIV) and also perform spray drift measurements, even in hot environments (such as in an exhaust stream). We are happy to carry out contract measurements for or together with you. In doing so, we can of course take into account the current standards for performance and measurement and advise on the evaluation of the results.

Please do not hesitate to contact us, we will be pleased to support you:

Contact
  • The measuring principle

  • The reference scale

  • Raw recording

  • Detected droplets

  • Droplet size distribution

How we measure.

For our measurements, we use a simple but very precise measuring method, namely that of the so-called “shadowgraph image technique”. The spray is positioned between a light source and a camera. The very bright light source creates a backlight that is picked up by the camera. If a droplet falls between the light source and the camera, it creates a shadow in the image, as shown in the animation on the left. Using a reference scale of known length, the size of each droplet can then be determined. In the reference image on the left, the inner circle corresponds to a diameter of 250 µm.  Since the droplets are mostly very small, we use a far-field microscope and can resolve droplet sizes down to 5µm. Due to the measurement method, many out-of-focus droplets appear in the raw data image. These droplets are outside the focal plane and can be larger or smaller than they are in reality and are therefore discarded for the distribution determination. With our automatic traversing device (traverse) we can automatically measure at different positions of the spray to also determine a position-dependent droplet size distribution. The recorded images are then evaluated by our in-house software (see below). The advantage of this measurement method is that we can get a good overview of spray properties. Most laser-based methods work mostly on a black box principle and thus provide little insight, but are blazingly fast.

How we analyze.

Due to time and budget constraints, our first algorithm was born on an ICE ride. This was based on a simple procedure. Using a recursive algorithm, each dark spot in the image was examined to see if it was closed and then the diameter was determined. This algorithm was then revised over time and replaced by a line-based algorithm, which was significantly faster and more reliable. In any case, a complex preparation of the images was necessary. In a first step, the image was inverted and the blurriest areas were filtered out using a threshold. The image was then binarized and filtered again, and the droplets were then determined. This procedure is time consuming and requires manual adjustment of the parameters. However, the method is very reliable and precise.

Original

Inverted

Binarized

Filtered

Final Result

Meanwhile, we have an algorithm based on machine learning that can reliably detect droplet sizes directly from the raw image. For this we use a neural network based on the Mask R-CNN from matterport (Region Based Convolutional Neural Network). The neural network was pre-trained for balloon detection and re-trained for droplet detection. The advantage is that this algorithm reliably detects droplets, but discards ligaments and lamellae and fuzzy droplets.

Original

Analyzed

Our Code. Your Code.

In 2016, we would have been very happy to use an existing code to perform droplet detection, but could not find a suitable one (which of course does not mean that there was none). So we had set out to develop a code ourselves and spent a lot of time and leisure on it. Since software development is not our core business, FDX decided to release the code and make it available to everyone. The following link will take you to our GitHub repository with more technical details about the code.

Link to GitHub

Your Point Contact. Our Specialist.

Do you have questions regarding our products? We are keen to advise you!

Cookie Consent with Real Cookie Banner